Square Grids
By far, the most commonly-employed grids are square grids. Square grids are convenient in that every cell is the same shape with the same orientation, and boundaries between rows or columns are straight lines. Indexing square grids is easy: (x, y), and extension to more dimensions is straightforward: (x, y, z), etc. Generating square grids in MATLAB is a breeze:
>> [X Y] = meshgrid(0:8)
X =
0 1 2 3 4 5 6 7 8
0 1 2 3 4 5 6 7 8
0 1 2 3 4 5 6 7 8
0 1 2 3 4 5 6 7 8
0 1 2 3 4 5 6 7 8
0 1 2 3 4 5 6 7 8
0 1 2 3 4 5 6 7 8
0 1 2 3 4 5 6 7 8
0 1 2 3 4 5 6 7 8
Y =
0 0 0 0 0 0 0 0 0
1 1 1 1 1 1 1 1 1
2 2 2 2 2 2 2 2 2
3 3 3 3 3 3 3 3 3
4 4 4 4 4 4 4 4 4
5 5 5 5 5 5 5 5 5
6 6 6 6 6 6 6 6 6
7 7 7 7 7 7 7 7 7
8 8 8 8 8 8 8 8 8
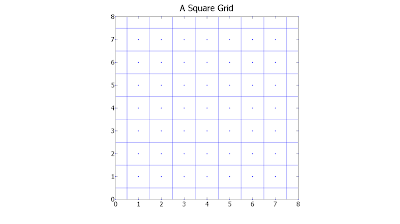
X and Y now contain the coordinates for the centers of the square cells, which can be plotted in MATLAB thus (click the figure to enlarge):
>> figure, voronoi(X(:),Y(:)), axis square

meshgrid-generated grids need not have the same axes, nor equal spacing. See 'help meshgrid' for more information. The linspace and logspace MATLAB routines are handy as meshgrid arguments, as well.
Hexagonal Grids
Despite their advantages, square grids do have one basic failing: their representations of circles and other non-rectangular forms are awkward.
With a square grid, cells surrounding a central cell have mixed distances. Repeated single-unit "hops" from a central cell (such as activation in a cellular automata) result in square or diamond patterns, not circles.
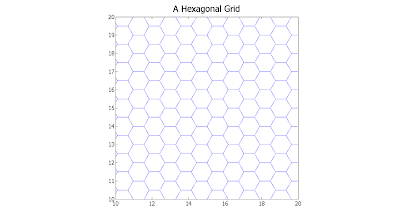
Hexagonal grids, one alternative to square grids, are much cleaner in their approximation of circular regions. All six immediate neighbors of any hexagonal cell are the same distance away. Repeated single-unit hops from a given hexagonal cell maintain a relatively "round" form (at least a better one than those provided by square grids).
Generating hexagonal grids is a bit trickier than generating square grids, but with a little geometry it can be done (as always, click the figure to enlarge):
% Generate hexagonal grid
Rad3Over2 = sqrt(3) / 2;
[X Y] = meshgrid(0:1:41);
n = size(X,1);
X = Rad3Over2 * X;
Y = Y + repmat([0 0.5],[n,n/2]);
% Plot the hexagonal mesh, including cell borders
[XV YV] = voronoi(X(:),Y(:)); plot(XV,YV,'b-')
axis equal, axis([10 20 10 20]), zoom on

Shifting the resulting grid coordinates is accomplished through addition. Scaling is accomplised by multiplication. Note that individual hexagons produced by the code above are oriented with their tops and bottoms flat. Rotating the cells so that the left and right sides are flat is a simple as reversing the rolls of the x and y coordinates in the code.
32 comments:
Hey Will,
That was a nifty post. What kind of applications would you use this for?
Anywhere one uses a square grid, one might consider a hexagonal grid: spatial sampling/aggregation, 2-dimensional binning, cellular automata, SOM neural networks, data visualization, cluster seeding, etc.
hi i want to find the center for each cell?
plz help me as soon as posible via matlab code
The hex cell grid centers are given by:
[X(:) Y(:)]
In other words,
[X(1) Y(1)]
...is the center of the first cell, and:
[X(2) Y(2)]
...is the center of the second cell, and so forth.
dear sir, how can we know the co-ordinate of vertices of an hex cell?
plz help me.
thank you sir
sameer0_5@yahoo.com
Check help voronoi.
Hi
Good Program
How do I reduce the number of cells and increase their cells. Say to have about 5 cells in a 5 by 5 axis.
Thanks
The size of the cells may be scaled by multiplying the generated coordinates. In other words:
X = 2 * X;
Y = 2 * Y;
...will double the size of the cells.
Hi!
How could I find the intersection (point) of three hex cells?
Thank you!!
hello
i want a code to plot just one hexagonal cell,because i want to built the grid by using for loop.
how i can specify the radius of the cell
thanx
thnx man its really amazing work but how can i mak matlab plot names for each cell depending on reuse system...suppose i have cluster size =7,???
Hi,
I am working on a project in which I need irregular shaped grid. Any irregular shape other than hexagon. Can you help me with that??
Hi,
I was wondering if it's possible to get the coordinates of each nods? And if it is, how would you do it?
Hi,
Can u help me to find the vertices some of the hex cell in the middle because i want to use the vertices in patch to fill the hex cell with color. i already use voronoin function but failed to define the vertices.
as i put [v,c] = voronoin([X(:) Y(:)]), it will color all the hex cell. Then, i use [v,c] = voronoin([X(4) Y(4)]), but there're errors because it cannot define the vertices of cell number 4. How can i fix that?
How can i apply this technique on image ? i mean converting from square grid to hexagonal grid
How can i apply this technique on image ? i mean converting from square grid to hexagonal grid
hello, Will. Thanks for your post.i found it very helpful.
How I can determine the energy levels of these hexagons.
Thanks
Hello sir..
Using Matlab I am able to establish a network of two tier cells with 19 BS and each BS has three sectors. Each sector has one directional antenna. Now my question is that, let my sector of interest is 1 of BS 1. now other 18 BS are interfering sources but not all sectors belonging to them because they have directional antennas. how can I determine these interfering sectors. any method or algorithm to determine all interfering sectors?
Is there a way to assign an integer number to each pixel and use it map an image ?
Hi Will,
That's a great code.
I would like to generate 3-D hexagonal grid. Would you please give me some hints on that?
Thank you.
Hello,
Is there a way to rotate the grid by a certain angle?
hey will,
In mtlab their 1 function "plotsomhits"
it similar to the Hexagonal Grid
Cna You please help me...
1.What a grid represent?
2.Every grid contains number.what that number represent.?
3.Every grid haveing blue color with different size..what that represent?
Hello everyone ,
In my porject,i'm asked to establish a network of two tier cells with 19 BS and each BS has three sectors. Each sector has one directional antenna.
I didn't succeed to make the repartition in sectors for my eNodeBs,I will be grateful if you help me.
Thant you in advance.
Dear Sir, It is extremely useful. How can I make a surfl kind of plot if I have data (height z) for each mesh. thanking u sncrnc@yahoo.com
Do you know how i could possibly use these hexagonal grid to generate a movie simulation of the grids lighting up defined by ODEs and a combination of the patch function? THANKS!
Very useful
Hi, kindly suggest a way to change the distance between the center of hexagons.
How can one overlap this on a map opened in Matlab?
I want to make 2D color plot for data visualization in hexagonal coordinate system. That mean I have pixelated space with hexagonal pixel and every pixel has a data value. So how can I plot that using pcolor function in matlab combined with your code?
Post a Comment