Class (or categorical) data is also very common. Class data has a finite number of possible values, and those values are unordered. Blood type, ZIP code, ice cream flavor and marital status are good examples of class variables. Importantly, note that even though ZIP codes, for instance, are "numbers", the magnitude of those numbers is not meaningful.
For the purposes of this article, I'll assume that classes are coded as integers (1 = class 1, 2 = class 2, etc.), and that the numeric order of these codes are meaningless.
How can class data be summarized? One very simple class summary is a list of distinct values, which MATLAB provides via the unique function. Slightly more complex is the frequency table (distinct values and their counts), which can be generated using the tabulate function from the Statistics Toolbox, or one's own code in base MATLAB, using unique:
>> MyData = [1 3 2 1 2 1 1 3 1 1 2]';
>> UniqueMyData = unique(MyData)
UniqueMyData =
1
2
3
>> nUniqueMyData = length(UniqueMyData)
nUniqueMyData =
3
>> FreqMyData = zeros(nUniqueMyData,1);
>> for i = 1:nUniqueMyData, FreqMyData(i) = sum(double(MyData == UniqueMyData(i))); end
>> FreqMyData
FreqMyData =
6
3
2
The closest thing to an "average" for class variables is the mode, which is the value (or values) appearing most frequently and can be extracted from the frequency table.
A number of measures have been devised to assess the "amount of mix" found in class variables. One of the most important such measures is entropy. This would be roughly equivalent to "spread" in a numeric variable.
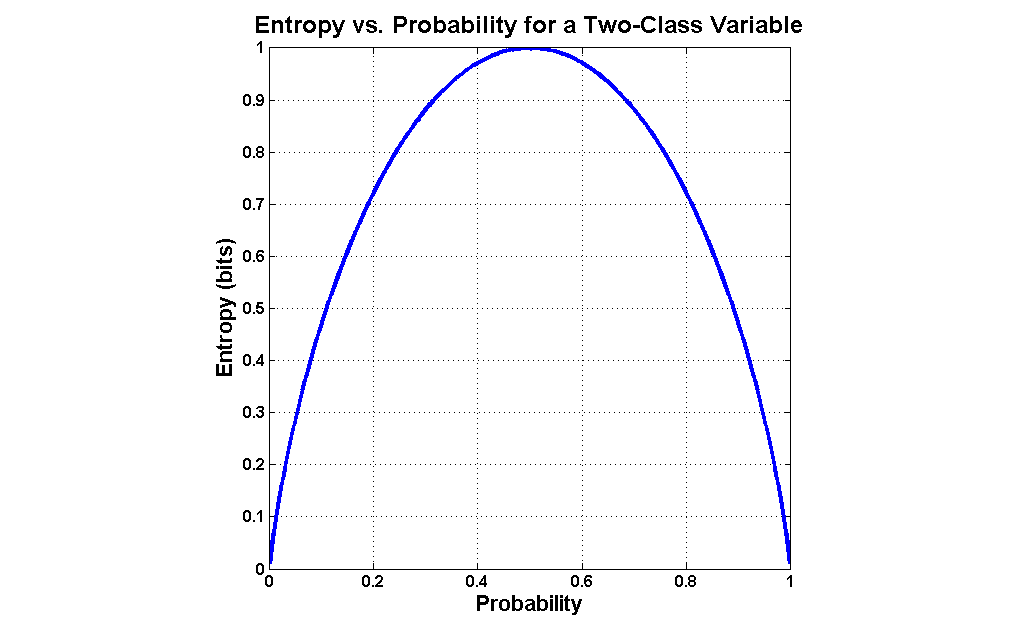
I will define entropy for two-valued variables, but it is worth first conducting a thought experiment to understand how such a measure should work. Consider a variable which assumes only 2 values, like a coin toss. The outcome of a series of coin tosses is a variable which can be characterized by its probability of coming up "heads". If the probability is 0.0 ("tails" every time) or 1.0 (always "heads"), then there isn't any mix of values at all. The maximum mix will occur when the probability of "heads" is 0.5- a fair coin toss. Let's assume that our measure of mixture varies on a scale from 0.0 ("no mix") to 1.0 ("maximum mix"). This means that our measurement function would yield a 0.0 at a probability of 0.0 (pure tails), rise to 1.0 at a probability of 0.5 (maximum impurity), and fall back to 0.0 at a probability of 1.0 (pure heads).
Entropy is exactly such a measure. It was devised in the late 1940s by Claude Shannon when he invented information theory (then known as communication theory). Entropy can be applied to variables with more than two values, but graphing the two-value case is much more intuitive (click the graph to enlarge):
The formula for entropy in the case of a two-valued variable is as follows:
entropy = -( p * log(p) + (1-p) * log(1-p) )
...where p is the probability of one class (it doesn't matter which one).
Most often, base 2 logarithms are used, which means that the calculated entropy is in units of bits. Generally, the more distinct values in the variable, and the more evenly they are distributed, the greater the entropy. As an example, variables with completely even distributions of values possess 1 bit of entropy when there are 2 values, 2 bits when there are 4 values and 3 bits when there are 8 values. The less evenly those values are distributed, the lower the entropy. For instance, a 4-valued variable with a 40%/20%/20%/20% split has an entropy of 1.92 bits.
Entropy is frequently used in machine learning and data mining algorithms for things like feature selection or evaluating splits in decision trees.
I have written a MATLAB routine to calculate the entropy of sample data in MATLAB (see details in help Entropy):
Entropy
This routine calculates the entropy of each column in the provided matrix, and will handle more than 2 distinct values per variable.
Further Reading / References
See, also, my postings of Apr-01-2009, Introduction to Conditional Entropy, and of Sep-12-2010, Reader Question: Putting Entropy to Work.
Note that, for whatever historical reason, entropy is typically labeled H in formulas, i.e.: H(X) means "entropy of X".
Print:
The Mathematical Theory of Communication by Claude Shannon (ISBN 0-252-72548-4)
Elements of Information Theory by Cover and Thomas (ISBN 0-471-06259)
On-Line:
Information Theory lecture notes (PowerPoint), by Robert A. Soni
course slides (PDF), by Rob Malouf
Information Gain tutorial (PDF), by Andrew Moore
14 comments:
Hi Will, you can also do the following to get the same answer:
MyData = [1 3 2 1 2 1 1 3 1 1 2]';
FreqMyData = histc(MyData,unique(MyData))
Regards,
Eric Sampson
The MathWorks
Thanks!
-Will
Notice that when you code the entropy function, you have to make the assumption that 0*log(0) = 0 (since log(0) is -Inf).
Yes, or avoid the issue by only calculating probabilities for symbols which actually appear in the variable. I used unique() in my code to get a list of the those symbols for exactly that reason.
Hi, I cant find the function called MutualInformation that is needed with ConditionalEntroy. Can you please put the link to it. I have a table of 31 columns with 500 rows, and I want to find Conditional Information gain on certain attributes. Thanks
Hi will, i admire the kind of work you do and appreciate your solution. i am not able to find MutualInformation as you mentioned. can you please put it online?
Hi Will,
Can we use entropy for distinguishing random signals and deterministic signal? Lets say i generate two signals in matlab. First signal using sin function and second using randn function. Can we use entropy to distinguish between these two signal?
Thanks
Yes, anonymous, we can, and I explain fully in my Sep-12-2010 posting, Reader Question: Putting Entropy to Work
Yes, Compuviz, you can find all 4 of my entropy functions at MATLAB Central's File Exchange: Entropy, JointEntropy, ConditionalEntropy and MutualInformation.
In addition to histc, here's another handy Matlab shortcut.
FreqMyData = accumarray(MyData,ones(size(MyData)))
Thanks for the tip, Nick.
Hi, thanks so much always your post helps me.
I need Mutual Information or Information Gain for continues variables, can you help me,please?
thanks sir, useful for my assignment
Hi. I used your function and noticed that entropy values are exceeding 1. H lies between and including 0 and 1, right?
Post a Comment